
Factory Savings Analyzer
Application for computing savings achieved with the installation of specialized units.
Problem Description
For some factories, compressed air can be likened to an energy source, just like electricity or heat. Any factory that uses pneumatic tools like drills and hammers requires a stable source of compressed air. However, it turns out, air doesn’t really like to stay put, and it’s very easy to have leaks in tubing. Compressed air consumers are also imperfect, and will leak air provided to them. Unused air has a cost to a factory, since it costs money to run air compressors. How, then, can factories minimize this cost?
A Japanese company (SMC) builds Air Management Systems, which aim to reduce air consumption, and in turn save factories money. In short, these systems are placed between the air compressor and the consumers, and can monitor when the consumers are in standby and no longer need air. When that happens, they reduce the provided pressure, which reduces air consumption, which has the nice effect of reducing energy wasted and increasing money saved.
This sounds wonderful! And it is. SMC makes some of the best systems in the market. They are lacking software, though. They don’t provide anything actionable for factory managers, which can’t quantify how much air was actually saved, and what the consumption of their several machines is like. Knowing how much air can be saved lets SMC sell more units, by having real data to provide as benchmarks. It also lets factory managers meet emissions targets, since a reduction in air consumption means a reduction in energy expenditure, and a measurable reduction unlocks access to grants. Knowing what the consumption of machines is like, in real time, is also crucial for recognizing when a machine has consumption parameters outside the norm.
Solution
The software for this was what I built, together with a friend:
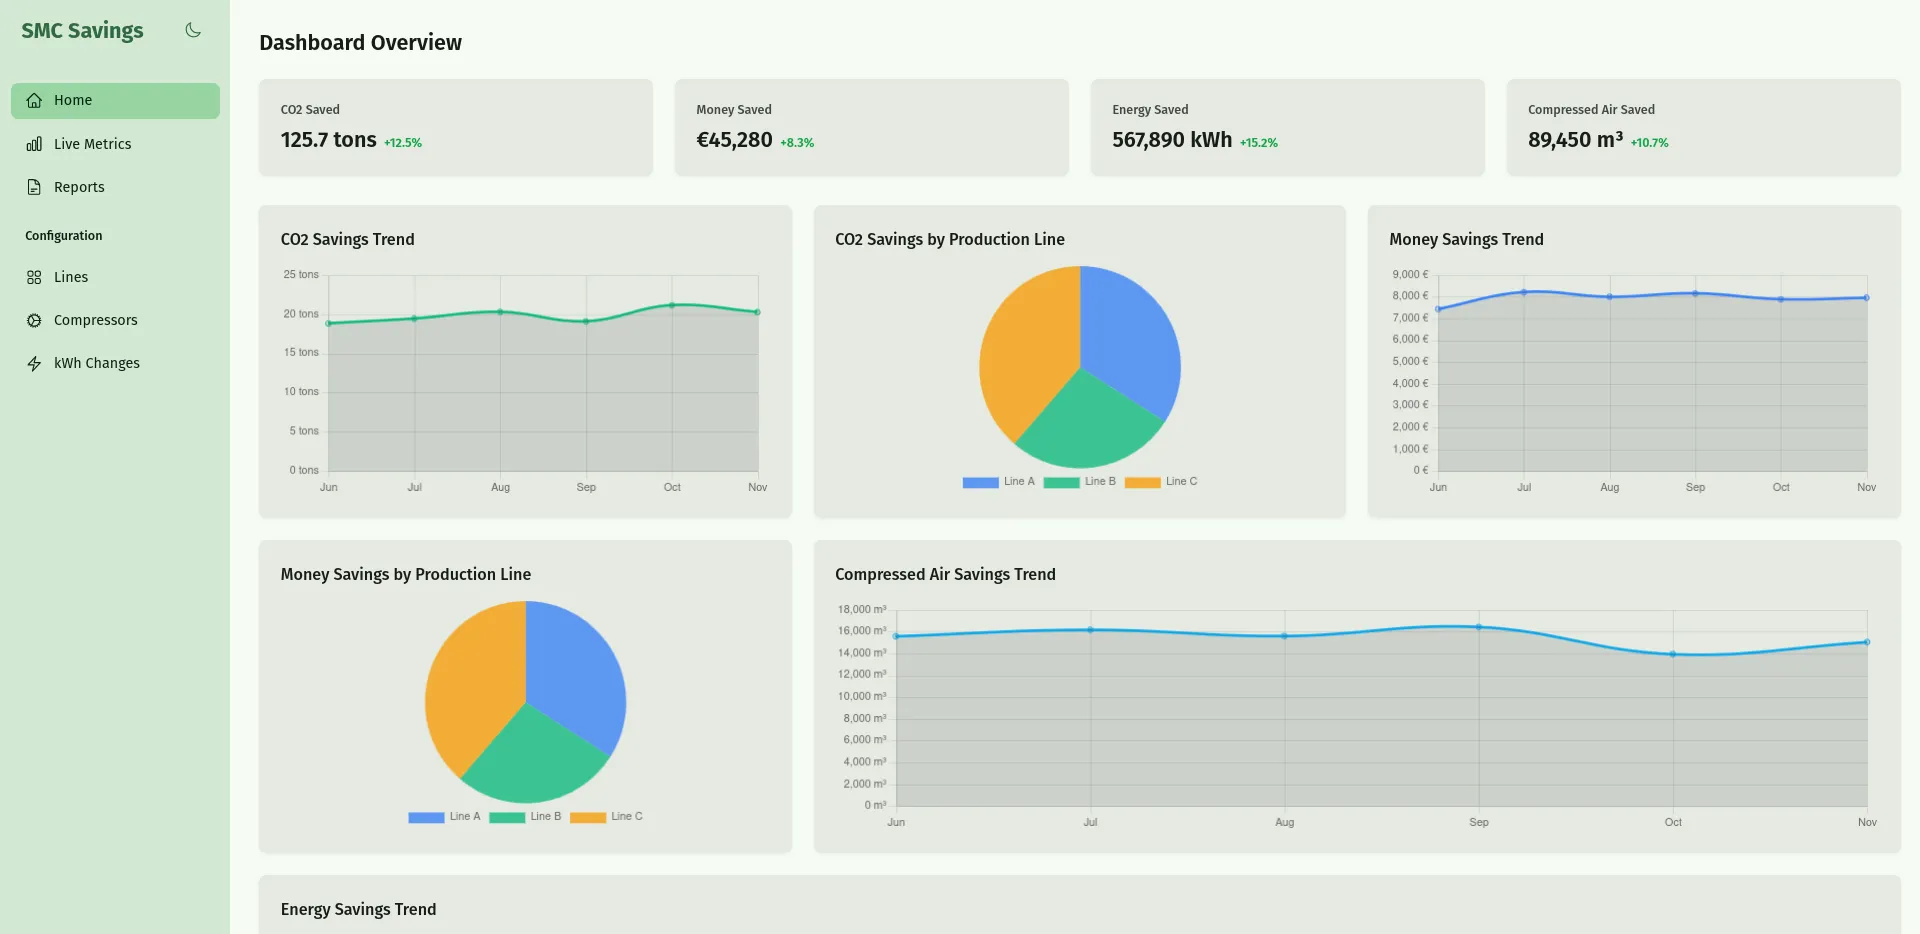
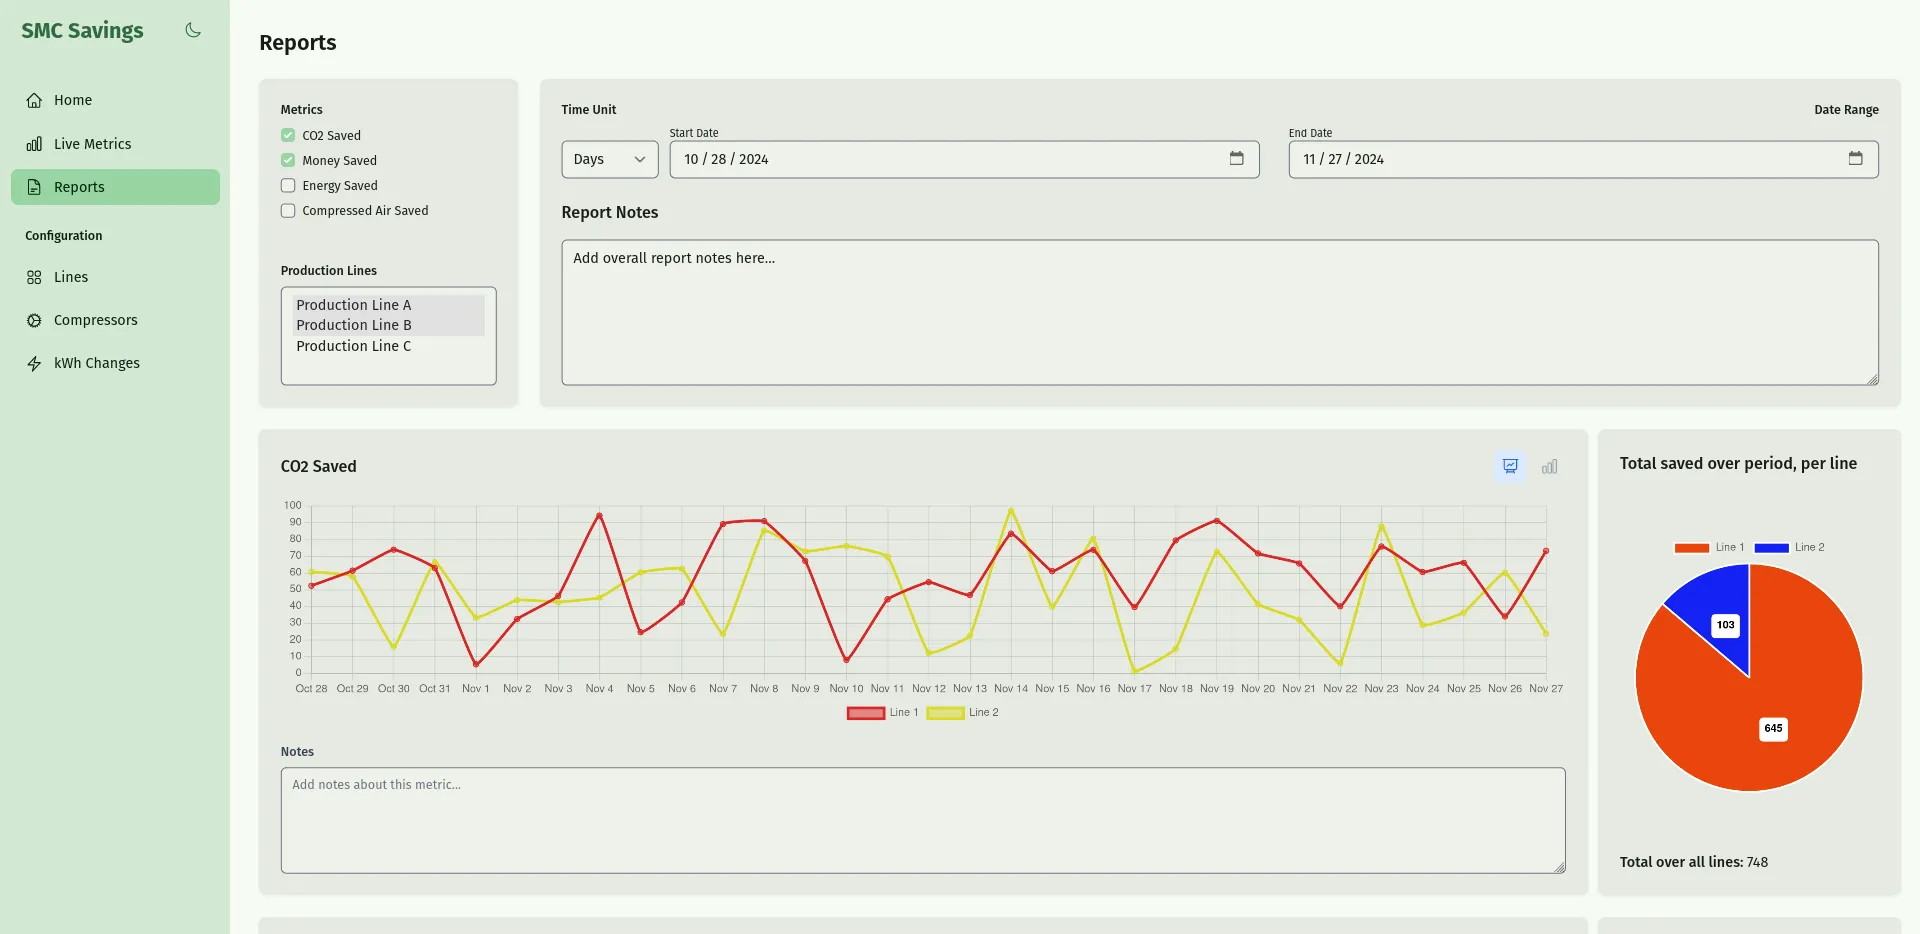
The main page provides an overview of the savings trends, where different machines may be under the same “Line”. Users can drill down into specific metrics and period, and build a report from them:
The live metrics page is, perhaps, the most useful in the day-to-day operations. It offers a birds eye view of specific lines (which may contain multiple machines), without having to physically go check them.
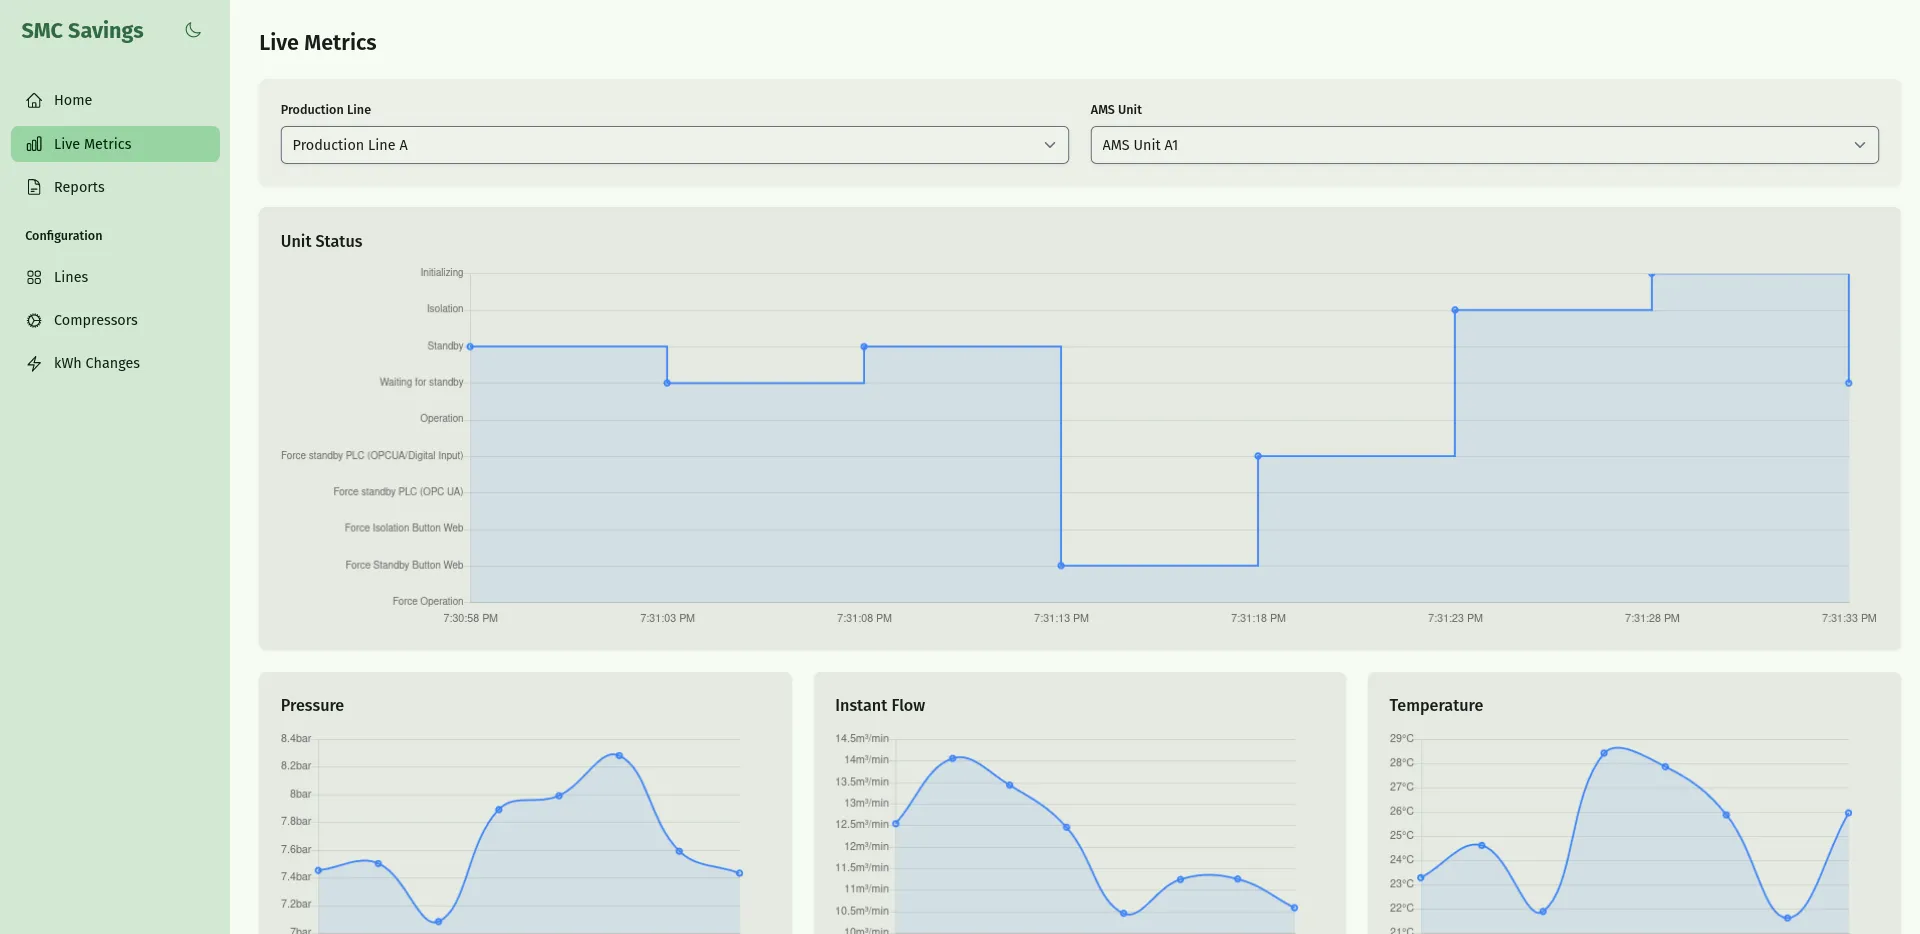
All of the charts update in real time, every 5 seconds.
Technical details
The architecture looks roughly like this:
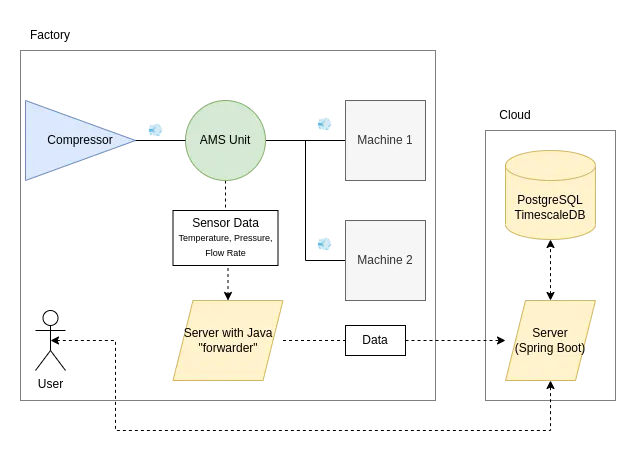
The AMS Unit, which regulates the compressed air pressure, communicates with a computer in the factory via OPCUA. I had never used this protocol before, and it took a while to understand, but it has a bunch of capabilities. By using ChatGPT and looking for examples online, I managed to:
- Find AMS Units dynamically
- Subscribe to updates
- Forward these updates in a nicer format to the cloud.
The cloud stores the data in a Timescale DB, ready for consumption and analysis over time. This might’ve been exaggerated at the start - I’m sure that a regular Postgres DB could handle the load of a couple of customers. But to avoid major refactorings, and since we were already expecting having to perform OLTP queries, we decided to start with Timescale to avoid pains.
In the future, it’s likely that we would have to introduce a queue somewhere for processing, as depending on the number of units in the system, there could be hundreds or eventually thousands of data points entering the servers and database. However, for an MVP, we considered this to be overkill and settled on a simpler solution.
Conclusion
We initially set out to build this project with a stakeholder and a pilot factory for testing. Unfortunately, priorities shifted and the project was put on hold. Without their support, we didn’t really have any place for proper testing and refinement, and eventually abandoned the idea. I’m a bit sad that we didn’t manage to go forward with the project, as it seemed really promising - however, I learned a ton about machine communication, new protocols, how to present findings to people, and got to build something that interacted with the real world.