Visualizing fire frequency in Portugal
How often do fires occur in Portugal? What is their average duration? I found the answers to some of these questions through automatic API scraping.
2025-05-22TL;DR
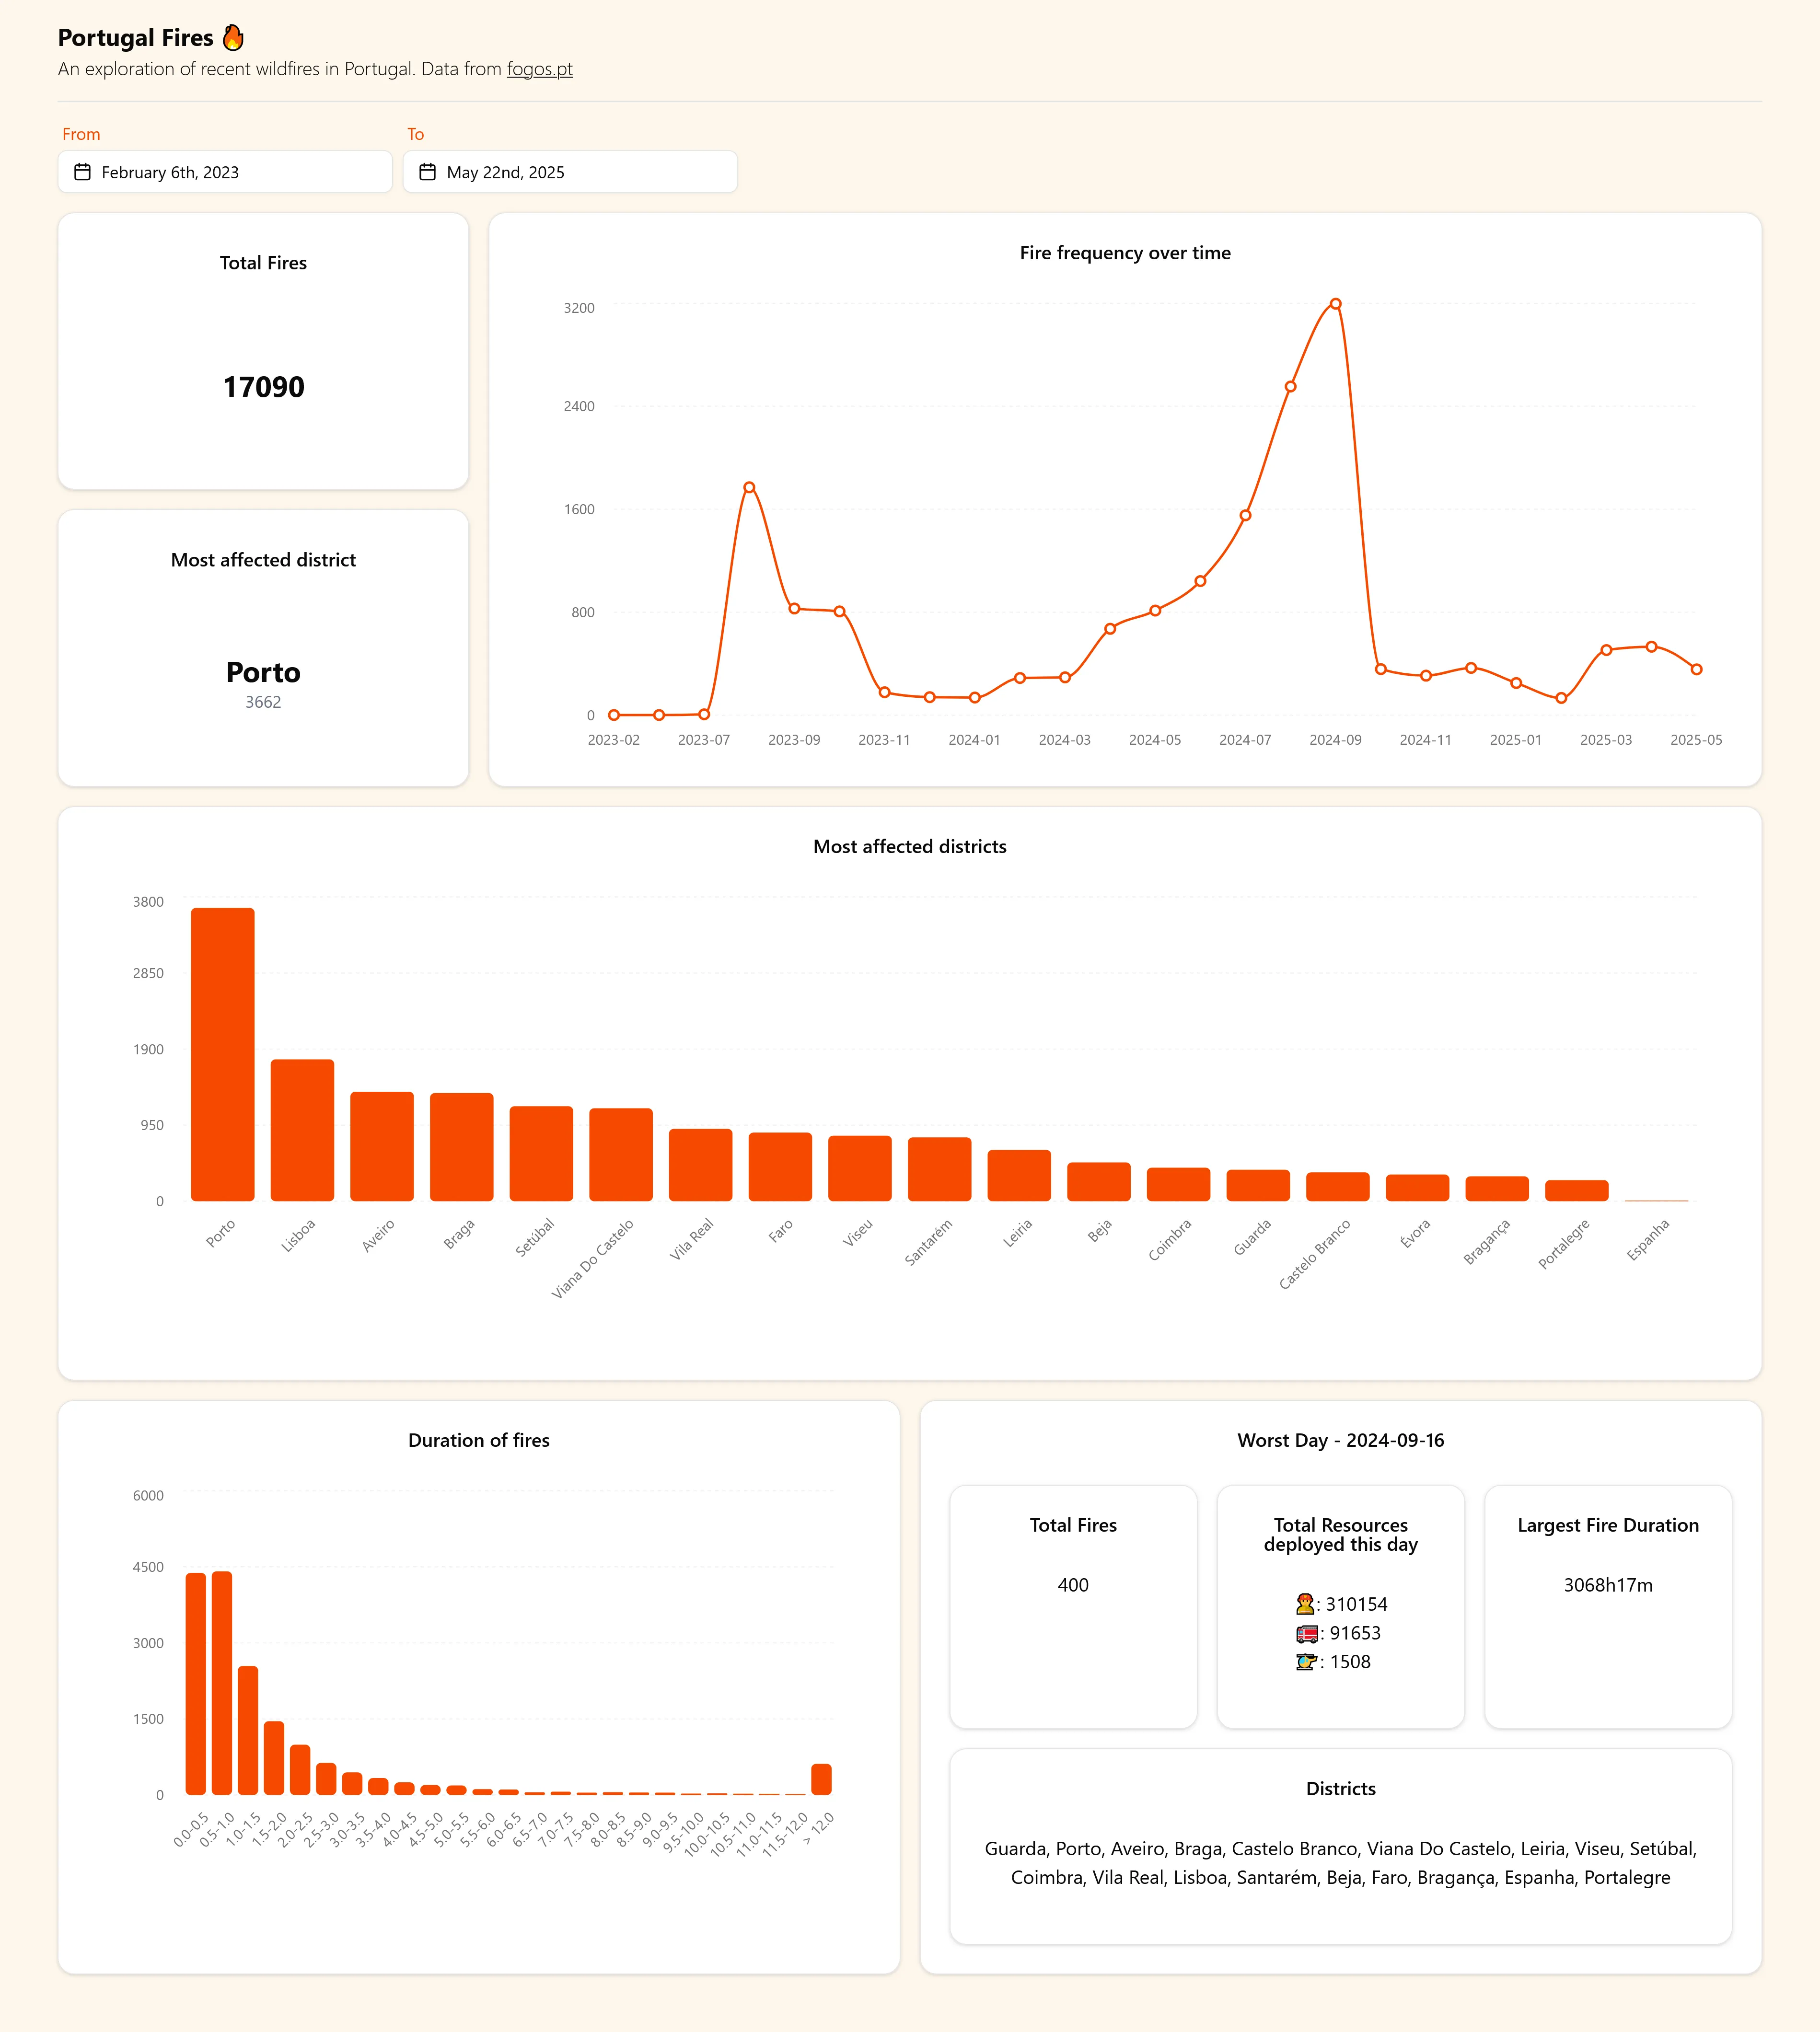
I built a dashboard for visualizing some data about wildfires in Portugal. You can check it out at https://fires.joaoestudante.com It was built with React, shadcn and Recharts for the frontend, and Flask (Python) for the backend. It’s deployed in a Hetzner VPS and managed with docker and Caddy. Here’s a screenshot, in case the website is down:
Context
Portugal has been the victim of pretty severe wildfires in the past years. There’s even a website developed by a volunteering association for checking active wildfires in the country, https://fogos.pt/. But the website only lets you easily see current wildfires, and I was curious about past ones and some statistics. Namely:
- What time of the year are there more fires? I supposed that it would be summer, but is it more towards the end or the beginning?
- What was the worst day, and how were resources deployed in that day?
- How long do most fires take to be resolved?
- Which regions of the country have the most fires?
Gathering data
Fogos.pt has a publicly exposed API that offers data for the current wildfires. This API is what they use to power their website, which shows a map with icons for fires:
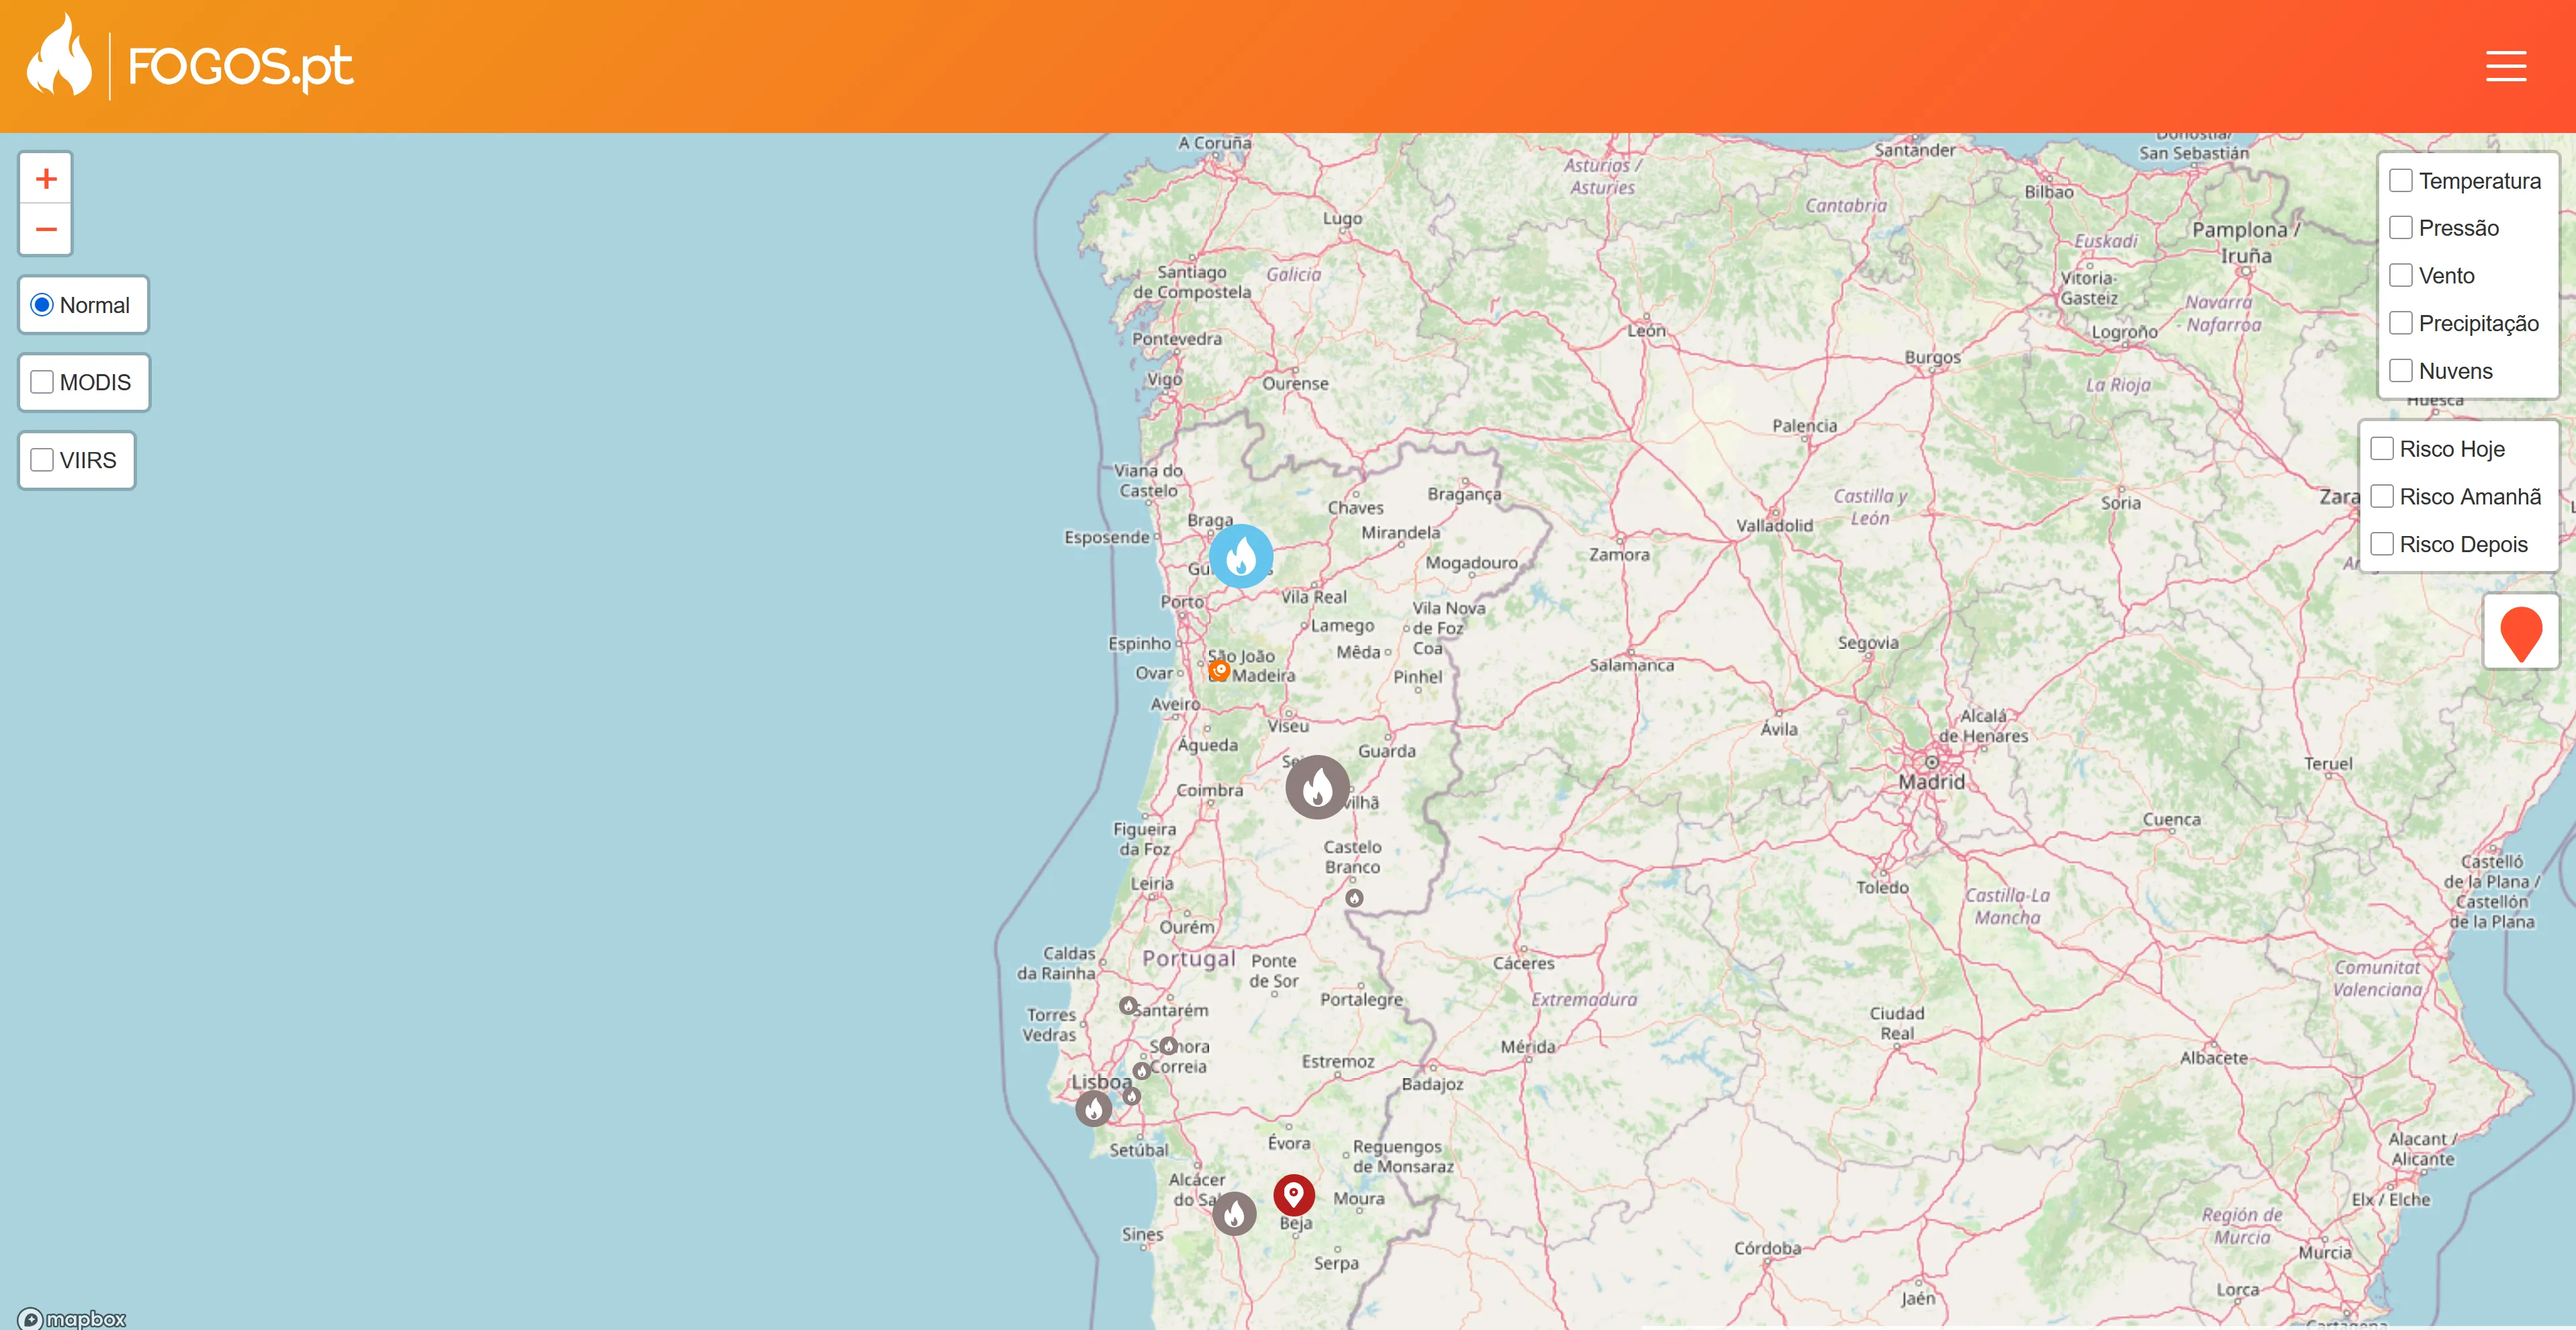
This map is generated through the following API response - I’m showing here only the data for the blue fire icon in the north of the country, with some keys removed for space sake:
API JSON Response
  "data": [
    {
      "_id": {
        "$id": "682efa414d5cbf6dc205c974"
      },
      "active": true,
      "concelho": "Seia",
      "district": "Guarda",
      "freguesia": "Alvoco Da Serra",
      "localidade": "Aguincho ",
      "location": "Guarda, Seia, Alvoco Da Serra",
      "regiao": "Centro",
      "sub_regiao": "Beiras e Serra da Estrela",
      "created": {
        "sec": 1747909185
      },
      "lat": 40.286822,
      "lng": -7.720935,
      "man": 38,
      "aerial": 0,
      "meios_aquaticos": 0,
      "status": "Conclus\u00e3o",
      "statusCode": 8,
      "terrain": 10,
      "updated": {
        "sec": 1747925891
      }
    },
    ...
  ]
To build a database with this API, I used what Simon Willson calls Git Scraping: https://simonwillison.net/2020/Oct/9/git-scraping/:
We already have a great tool for efficiently tracking changes to text over time: Git. And GitHub Actions (and other CI systems) make it easy to create a scraper that runs every few minutes, records the current state of a resource and records changes to that resource over time in the commit history.
And he’s completely right! So I wrote a simple Git Action that makes a request to the fogos.pt endpoint every 5 minutes and saves the resulting JSON in a file. To build the database, I have another script which goes over all commits, and stores the fires and their updates in two tables in a single sqlite3 database. You can check out both of them in https://github.com/joaoestudante/fogos-portugal.
Result
The dashboard I built is more of an auto report than a dashboard, honestly. Dashboards usually offer more interaction and customization. Nevertheless, it helped me find some interesting things about the data, which I have been gathering since early 2023:
- A total of around 17k fires were recorded (as of this blog post).
- The most affected district is Porto. I wasn’t expecting this one, since it’s a district where it rains a lot and is further north than where wildfires usually rage.
- The vast majority of fires are resolved within 4 hours, with many under 2 hours. This is great!
- There are some fires which have a duration of over 12 hours. Almost all were in a “Monitoring” state for weeks or months - I’m considering just removing this last state and only consider state updates until a “Conclusion” state, but I’m not sure if there are fires that moved from “Conclusion” to “Active” which I would be missing by doing it.
- The worst day (so far ☝️) was September 16th of 2024, where 400 fires were registered. This is an insane number that I absolutely wasn’t expecting. Almost all districts had a fire going on somewhere.
- August and September of 2024 were the worst months. There’s also a spike in August of 2023, but it probably wasn’t as high as 2024’s because I was collecting data less often: only every 20 minutes. This missed some smaller fires. I changed it to every 5 minutes in May of 2024.
Stack
I chose to use React and shadcn mostly for practice and the easy to use charts provided by shadcn. I also used Redux to manage state updates to the dates and propagate them to all charts, so they can re-render when the dates in the filters update. Redux is probably way overkill for this - a context would’ve been fine - but I had never used the library and wanted to learn more about it.
The backend was built with Flask, since my focus on this project was the frontend, and I just needed a simple backend for querying the sqlite3 database.
I deployed this in the cheapest Hetzner VPS there is, and set up everything with Caddy and Docker. There’s still some automation to be done so that data gets updated every day, but it’s a solid setup.